Cainmani

Energy Cost and Demand Optimisation

Your electricity bill depends on when you use energy as well as how much. We look at production scheduling, time-of-use prices, demand and capacity charges, power factor and the role of solar and storage as one system. You receive a set of options, each with its cost and saving, and choose what suits your operation.

Engineer checking an energy meter in a factory switch room (concept image)

Where the bill comes from

We review interval demand, time-of-use consumption, maximum demand, operating schedules and the loads that can move. Each measure is ranked by estimated benefit, investment and operational impact.

Some measures need only scheduling or control changes. Others need equipment, storage or a different supply arrangement. We report energy saved separately from energy moved to a cheaper period.

Lower energy costs through smarter consumption

Savings by measure, assessed separatelyModelled site: 2 MVA connection, 6 GWh a year, Eskom Megaflex 2026/27
Bill savingsMeasured as % of the annual electricity bill
Load shifting

5–10% of annual consumption moved from peak to off-peak periods. Gross saving before implementation costs.

5–11%lower annual electricity bill
Energy efficiency

Annual energy use reduced by 5–10%, with notified capacity unchanged.

4.3–8.6%lower annual electricity bill
Solar energy service

20–40% of consumption supplied at R1.20/kWh in place of energy costing R2.10/kWh. Fixed charges unchanged, and prices are scenario inputs.

7–14%lower annual electricity bill
Demand reductionMeasured as % of apparent demand (kVA)
Power factor correction

Power factor raised from 0.90 to 0.98, with energy use unchanged.

8.2%lower apparent demand (kVA)

Each result comes from one modelled site. Your savings depend on your tariff, load profile and operating limits, and we assess them for your site before recommending any measure.

Cold storage and industrial refrigeration

A cold store can pre-cool within its approved temperature range before an expensive tariff period, then reduce compressor demand for a short interval, such as 30 minutes, where the validated thermal margin, product limits and controls allow.

We assess the opportunity from temperature behaviour, compressor performance, recovery demand and the tariff, and the saving includes the extra energy used before and after each event.

Industrial refrigeration condensing units with cooling fans
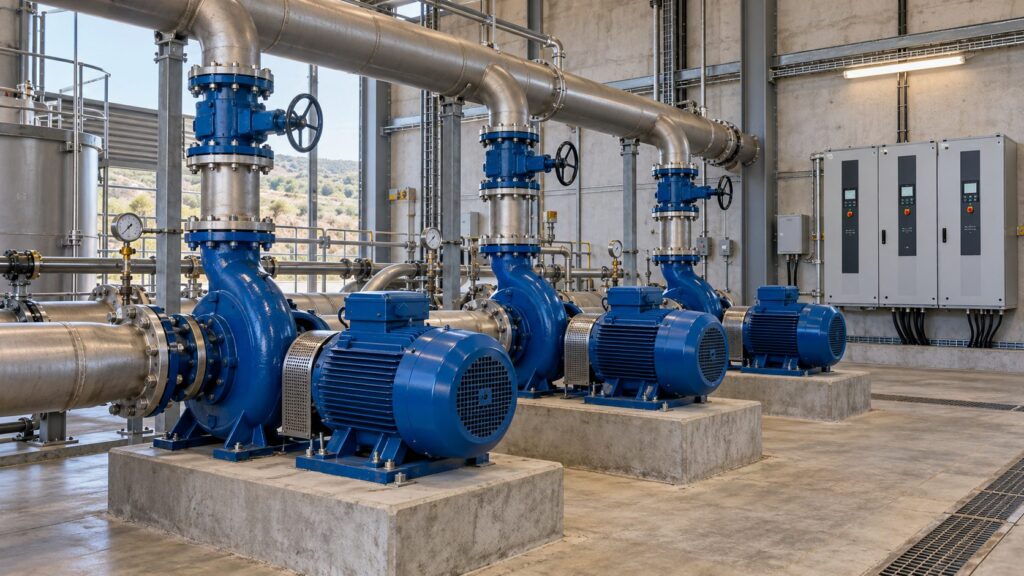
Industrial pump station with electric motors and drives (concept image)

Pumping and process loads

Where buffer storage and process requirements allow, pumping can be scheduled towards periods with available solar generation or lower electricity prices. The operating plan must preserve required storage levels, pressure, throughput and safety limits.

Fleet and equipment charging

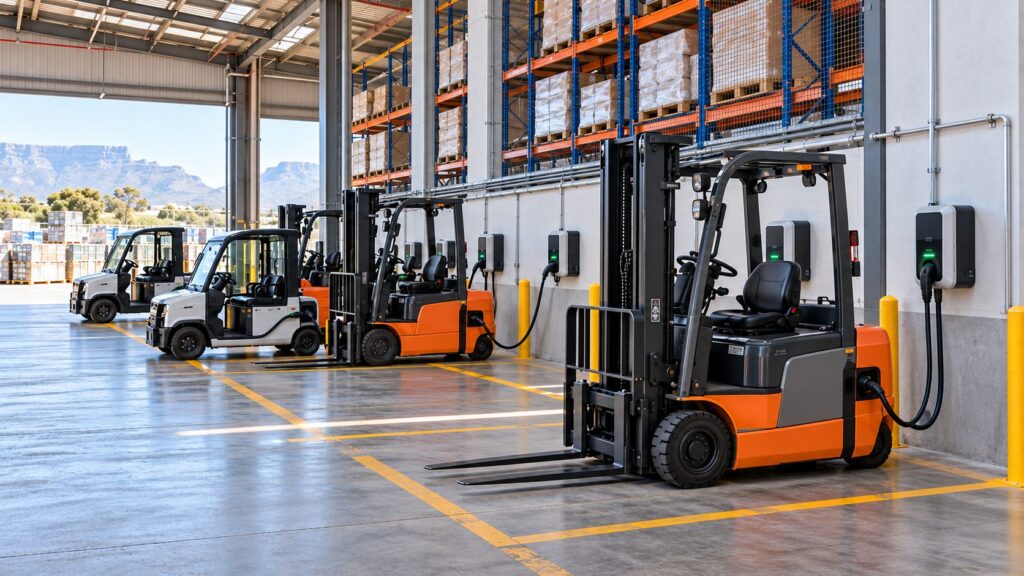
Charging can be scheduled around vehicle availability, solar output and the site’s demand limit. Prioritising the next vehicles needed and staggering charger starts can avoid an unnecessary demand peak.

Electric forklifts charging in an industrial depot (concept image)
Engineers reviewing a site layout in a plant office (concept image)

The operating plan

We set out the recommended measures, estimated savings, investment and priorities. For each measure taken forward, we agree the operating limits, monitoring and performance baseline with your site team.

Results are measured against that baseline, adjusted for material changes in production, weather or operating hours.

Request a tariff review

Send us 12 months of bills or meter data and your production pattern.

Related services: On-site energy | Wheeling | Mining and fleet electrification